
BLOG

2026 Best Plastic Companies for Global Buyers?

Choosing the right plastic company in 2026 requires more than comparing price lists. Global buyers must examine production capacity, material quality, certifications, delivery records, and environmental performance. A polished website proves very little. Factory evidence matters more.

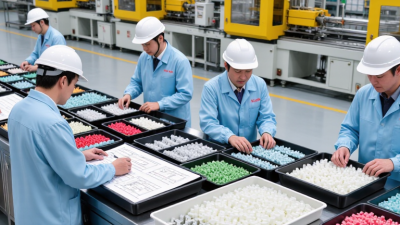
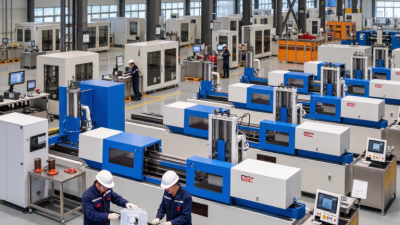
This guide explores leading plastic companies for international purchasing teams. It considers packaging producers, injection molding specialists, engineering plastic manufacturers, and recycled-material suppliers. The evaluation looks at resin traceability, mold precision, testing equipment, worker safety, and export experience. Buyers should request sample parts, inspection reports, and clear technical datasheets before signing contracts. A factory floor tells a useful story: labeled resin bags, calibrated machines, clean storage areas, and trained technicians usually signal disciplined operations.

Still, no ranking is perfect. Supplier data can change quickly. Some companies report sustainability broadly but provide limited evidence. That weakness deserves attention. Ellen MacArthur, a leading circular-economy authority, said, “There is no such thing as waste, only resources in the wrong place.” Her observation remains highly relevant to plastics procurement. Recycled content, reusable designs, repairability, and responsible end-of-life planning should influence purchasing decisions.

The best supplier is not always the largest one. It may be the company that answers technical questions clearly, reports limitations honestly, and improves after a failed sample. Delivery delays happen. Specifications can be misunderstood. Good communication reduces both risks.

This article helps global buyers compare plastic companies through practical, evidence-based criteria. It also highlights warning signs that deserve a second look. Cost matters, but dependable performance matters longer.

2026 Best Plastic Companies for Global Buyers?

Global Plastics Market Scale: 413.8 Million Tonnes Produced in 2023

2026 Best Plastic Companies for Global Buyers?

Global plastics production reached 413.8 million tonnes in 2023, according to Plastics Europe’s Plastics – the Fast Facts 2024 report. Production declined slightly from 418.5 million tonnes in 2022. This change looks small, but it affects resin availability, freight planning, and contract pricing. Buyers should examine monthly capacity, feedstock exposure, and delivery records rather than rely on impressive catalogues.

Scale alone does not prove reliability. A capable supplier should provide consistent melt-flow data, batch traceability, technical datasheets, and clear quality procedures. For packaging and industrial applications, buyers can request samples from several production lots. Measure tensile strength, impact resistance, moisture, and dimensional stability. Small testing costs are sensible. One overlooked variation can disrupt an entire production line.

The OECD Global Plastics Outlook reports that global plastic waste reached 353 million tonnes in 2019, with only 9% recycled. That figure remains a serious purchasing signal. Companies with recycled-content controls, material documentation, and practical end-of-life information deserve closer review. However, recycled polymers may show greater batch variation, especially without strong sorting and testing systems. This is where procurement teams need experience, not only certificates. I would also question forecasts that promise unlimited supply or perfect consistency. Markets change faster than many sales sheets admit.

2026 Best Plastic Companies for Global Buyers? – Global Plastics Market Scale: 413.8 Million Tonnes Produced in 2023

Regional production scale and buyer-oriented sourcing context for the global plastics industry

Production Region 2023 Share of Global Production Estimated 2023 Output
(Million Tonnes)
Relative Production Scale Global Buyer Considerations
China 32% 132.4 Largest regional production base Broad polymer availability, extensive conversion capacity, and a large domestic manufacturing ecosystem.
Rest of Asia 19% 78.6 Major multi-country supply cluster Important source for commodity resins, packaging materials, textile-related polymers, and molded products.
North America 17% 70.3 High-volume and technologically mature market Strong feedstock integration, established standards, and significant supply of commodity and engineering plastics.
Europe 14% 57.9 Large, regulated production market Strong focus on product compliance, circularity, recycled materials, and advanced technical applications.
Middle East and Africa 8% 33.1 Important feedstock-oriented region Significant role in petrochemical-based resin production, with export-oriented supply chains in selected markets.
Latin America 4% 16.6 Developing regional production base Relevant for regional packaging, construction, agriculture, consumer goods, and industrial plastics demand.
Commonwealth of Independent States 3% 12.4 Smaller but strategically relevant market Production and trade conditions vary considerably by country, polymer type, infrastructure, and logistics route.
Japan 3% 12.4 Specialized and technology-intensive market Known for demanding quality requirements and strong capabilities in high-performance and engineering plastics.
Global Total 100% 413.8 Worldwide plastics production in 2023 Regional figures support high-level sourcing analysis; supplier qualification should also assess specification, certification, capacity, lead time, and total landed cost.
Data note: Global production totaled 413.8 million tonnes in 2023. Regional shares are presented as reported industry-level estimates; regional tonnage figures are calculated by applying each share to the global total and rounded to one decimal place. Source reference: Plastics Europe, Plastics – the Fast Facts 2024.

How to Rank Plastic Companies by Capacity, Revenue, and Global Reach

2026 Best Plastic Companies for Global Buyers?

Ranking plastic companies requires more than comparing impressive websites. Start with verified production capacity, measured in tonnes per year and separated by process. Injection molding, extrusion, blow molding, and recycling lines serve different purchasing needs. A factory listing 100,000 tonnes may report nameplate capacity, not actual output. Ask for recent utilization rates, equipment age, maintenance records, and average lead times.

Revenue offers another useful signal, but it needs context. A large figure can hide heavy dependence on one market or a volatile raw-material cycle. Review several years of audited financial information when available. Compare operating margins, investment in quality systems, and spending on process improvement. Customer references can reveal details that financial tables miss, including shipment accuracy and response speed.

Global reach should be measured operationally. Check warehouse locations, export experience, port access, customs documentation, and support across time zones. Reliable suppliers explain quality controls through batch testing, traceability, and recognized management standards. They should also provide clear material specifications and practical samples before large orders. Some data will remain incomplete, especially for private manufacturers. That is a weakness in the ranking, not a reason to invent precision. A transparent scorecard may weigh capacity at 35%, financial strength at 25%, and global delivery capability at 40%. The percentages are debatable. Real purchasing decisions rarely fit a perfect formula.

Leading Polymer Producers: PE, PP, PVC, PET, and Engineering Plastics

2026 Best Plastic Companies for Global Buyers?

Global polymer purchasing is shifting from price-only decisions to verified performance. Plastics Europe reported global plastics production near 414 million tonnes in 2023. That scale hides major quality differences between producers. Buyers should examine resin consistency, certification, delivery records, and technical support.

Polyethylene remains essential for films, containers, and pipes. High-density grades need stable density and impact strength. Polypropylene serves automotive parts, woven packaging, and medical components.

The OECD’s Global Plastics Outlook notes that plastics production doubled from 2000 to 2019, increasing pressure on traceability and waste management. PVC buyers should check chlorine content, additives, weather resistance, and regional compliance. Small formulation changes can affect processing.

PET requires careful control of intrinsic viscosity, moisture, and acetaldehyde. Engineering plastics demand deeper testing. Polyamide, polycarbonate, and PBT grades may need heat aging, flame resistance, or dimensional stability data. The International Energy Agency identifies chemicals and plastics as major industrial energy users, so energy efficiency and emissions reporting deserve attention. Ask for recent test reports, not only brochures. Ask again.

A practical supplier review should compare batch records, plant capacity, export experience, and complaint response times. Data may vary between reports and regions. That uncertainty matters. A low-cost resin can become expensive after rejected batches, mold adjustments, or delayed shipments. Global buyers should keep pilot orders and independent testing in the process, even when a producer appears reliable.

Sustainability Benchmarks: Recycled Content, Emissions, and Circularity Data

2026 Best Plastic Companies for Global Buyers?

Sustainability claims now need measurable evidence. The OECD’s Global Plastics Outlook reports that only 9% of plastic waste was recycled globally in 2019. About 50% went to landfill, while 22% was mismanaged. These figures expose a difficult purchasing reality. A supplier may offer recycled resin, yet regional collection systems can remain weak. Buyers should request recycled-content percentages, verification methods, and material traceability.

Emissions data matters just as much. The OECD estimates that plastics generated 1.8 gigatonnes of CO2-equivalent emissions in 2019. That represented roughly 3.4% of global emissions. Reliable suppliers should separate Scope 1, Scope 2, and relevant Scope 3 emissions. Product-level carbon data is more useful than a broad corporate promise. Ask for the system boundary, energy mix, allocation method, and reporting year.

Circularity needs practical proof. The Ellen MacArthur Foundation’s circularity guidance emphasizes designing products for reuse, repair, and recycling. Buyers can examine recycled input, take-back rates, scrap recovery, and actual post-use outcomes. A recyclable label is not enough. Local sorting capacity may decide the result. I would also challenge optimistic forecasts. Public data remains uneven, and some calculations depend on assumptions. That weakness deserves disclosure, not polished language. Reliable procurement compares audited evidence, not attractive sustainability slogans.

How Global Buyers Compare Certifications, Supply Chains, and Total Cost

Global buyers compare plastic companies through evidence, not polished sales claims. A current ISO 9001 certificate can show controlled processes, but it does not guarantee consistent parts. Buyers should check the certificate scope, issuing body, expiration date, and production site. Environmental certificates, material declarations, and product-specific compliance documents may also matter. Ask whether test reports match the exact resin, color, and application.

Supply chain visibility is equally important. Request resin origin, lot traceability, mold ownership terms, and documented quality checks. A capable supplier should explain backup production plans and realistic lead times. Port congestion, customs delays, and seasonal capacity can change delivery performance. One overlooked detail is packaging. Poor protection can create scratches, deformation, and extra inspection work.

Total cost goes beyond the unit price. Include tooling, sampling, testing, freight, duties, payment fees, storage, scrap, and corrective actions. A cheaper quotation may become expensive after repeated delays or unstable dimensions. Compare landed cost across several shipment volumes. Small orders can carry hidden setup costs. Large orders can increase inventory risk. No scorecard is perfect. Buyers should review actual samples, production records, and communication quality before committing. Even then, assumptions may fail, so contracts should define inspection standards, remedies, and review points clearly.

2026 Best Plastic Companies for Global Buyers

Buyer comparison based on certification readiness, supply-chain performance, and total-cost competitiveness.

Scores are normalized to a 100-point scale. Certification readiness reflects documented quality, environmental, and product-compliance systems; supply-chain performance reflects lead-time consistency and export capability; total-cost competitiveness includes material, conversion, logistics, and compliance costs.

Go to Top